Guest Feedback Metrics: What Hotels Should Track and How to Interpret the Results
28/10/2026
28/10/2026
10

Analia Mendonca
Which guest feedback metrics should hotels track? How to read each score in context and link it to its cause.
Book a Demo


Which guest feedback metrics should hotels track? How to read each score in context and link it to its cause.
Book a Demo








An average score of 8.4 feels like it means something on its own. It doesn't, not until you know whether it's stable or just fell from 9.1, whether it came from your strongest channel or your weakest, and how it compares to the competitors your guests are actually choosing between.
Measurement used to mean numbers. Now it has two halves: the numbers themselves, and the reasons behind them, which are measurable too. Reading metrics correctly, and reading both halves together, matters as much as picking the right ones.
For years, measuring guest feedback meant one thing: track the scores, the rates, the volume. That’s the “what,” and it still matters. What's new is the "why": the actual reasons behind those numbers, which used to feel unquantifiable, a hundred guests writing a hundred different sentences, and is now measurable at scale because AI can read and organize what guests write.
The old discipline was reading the numbers well. The new discipline, often called guest feedback intelligence, is reading the numbers and the reasons behind them together.
Before naming a single metric, there's one rule that decides whether any of them can be trusted: your feedback data has to work at more than one altitude. The person running a single property needs the detail, a wet towel left on the pool deck. The regional director needs to know whether that same issue is happening at one hotel or at twelve. The executive needs one trend line to bring to the board.
That's the same data, seen three different ways. If those views don't reconcile, if the group number and the property number tell different stories, people quietly stop trusting the data and drift back to gut feel. So the first rule isn't really a metric at all: whatever you measure has to roll up and drill down cleanly, one truth, seen at every level, from the front desk to the boardroom.
Start with the half you already know: the numbers, or the “what.” The key is understanding what each metric tells you, and what it leaves out.
A headline score can hide very different stories underneath it. One platform may be improving while another declines, one property may be pulling down the group average, and competitors may be moving faster than you are. That is why a score needs context before it can guide a decision.
To read it properly, look at four things: its direction, the platform it comes from, how performance differs across properties, and how it compares with competitors.
Never read a score in isolation. Ask which way it is moving, where it is coming from, how performance differs across properties, and how it compares with the competition.
There is also a limit to how quickly headline metrics can tell you that something is changing. An average score reflects experiences that have already happened and can take time to move. Changes often become visible earlier in the feedback behind the number, for example when one issue starts appearing more frequently or sentiment around a particular part of the stay begins to shift.
This is where the feedback behind the score becomes measurable. The reasons used to feel difficult to quantify: a hundred guests writing a hundred different sentences that nobody had time to read in full. That is no longer the case, and measuring the “why” now happens in two distinct moves.
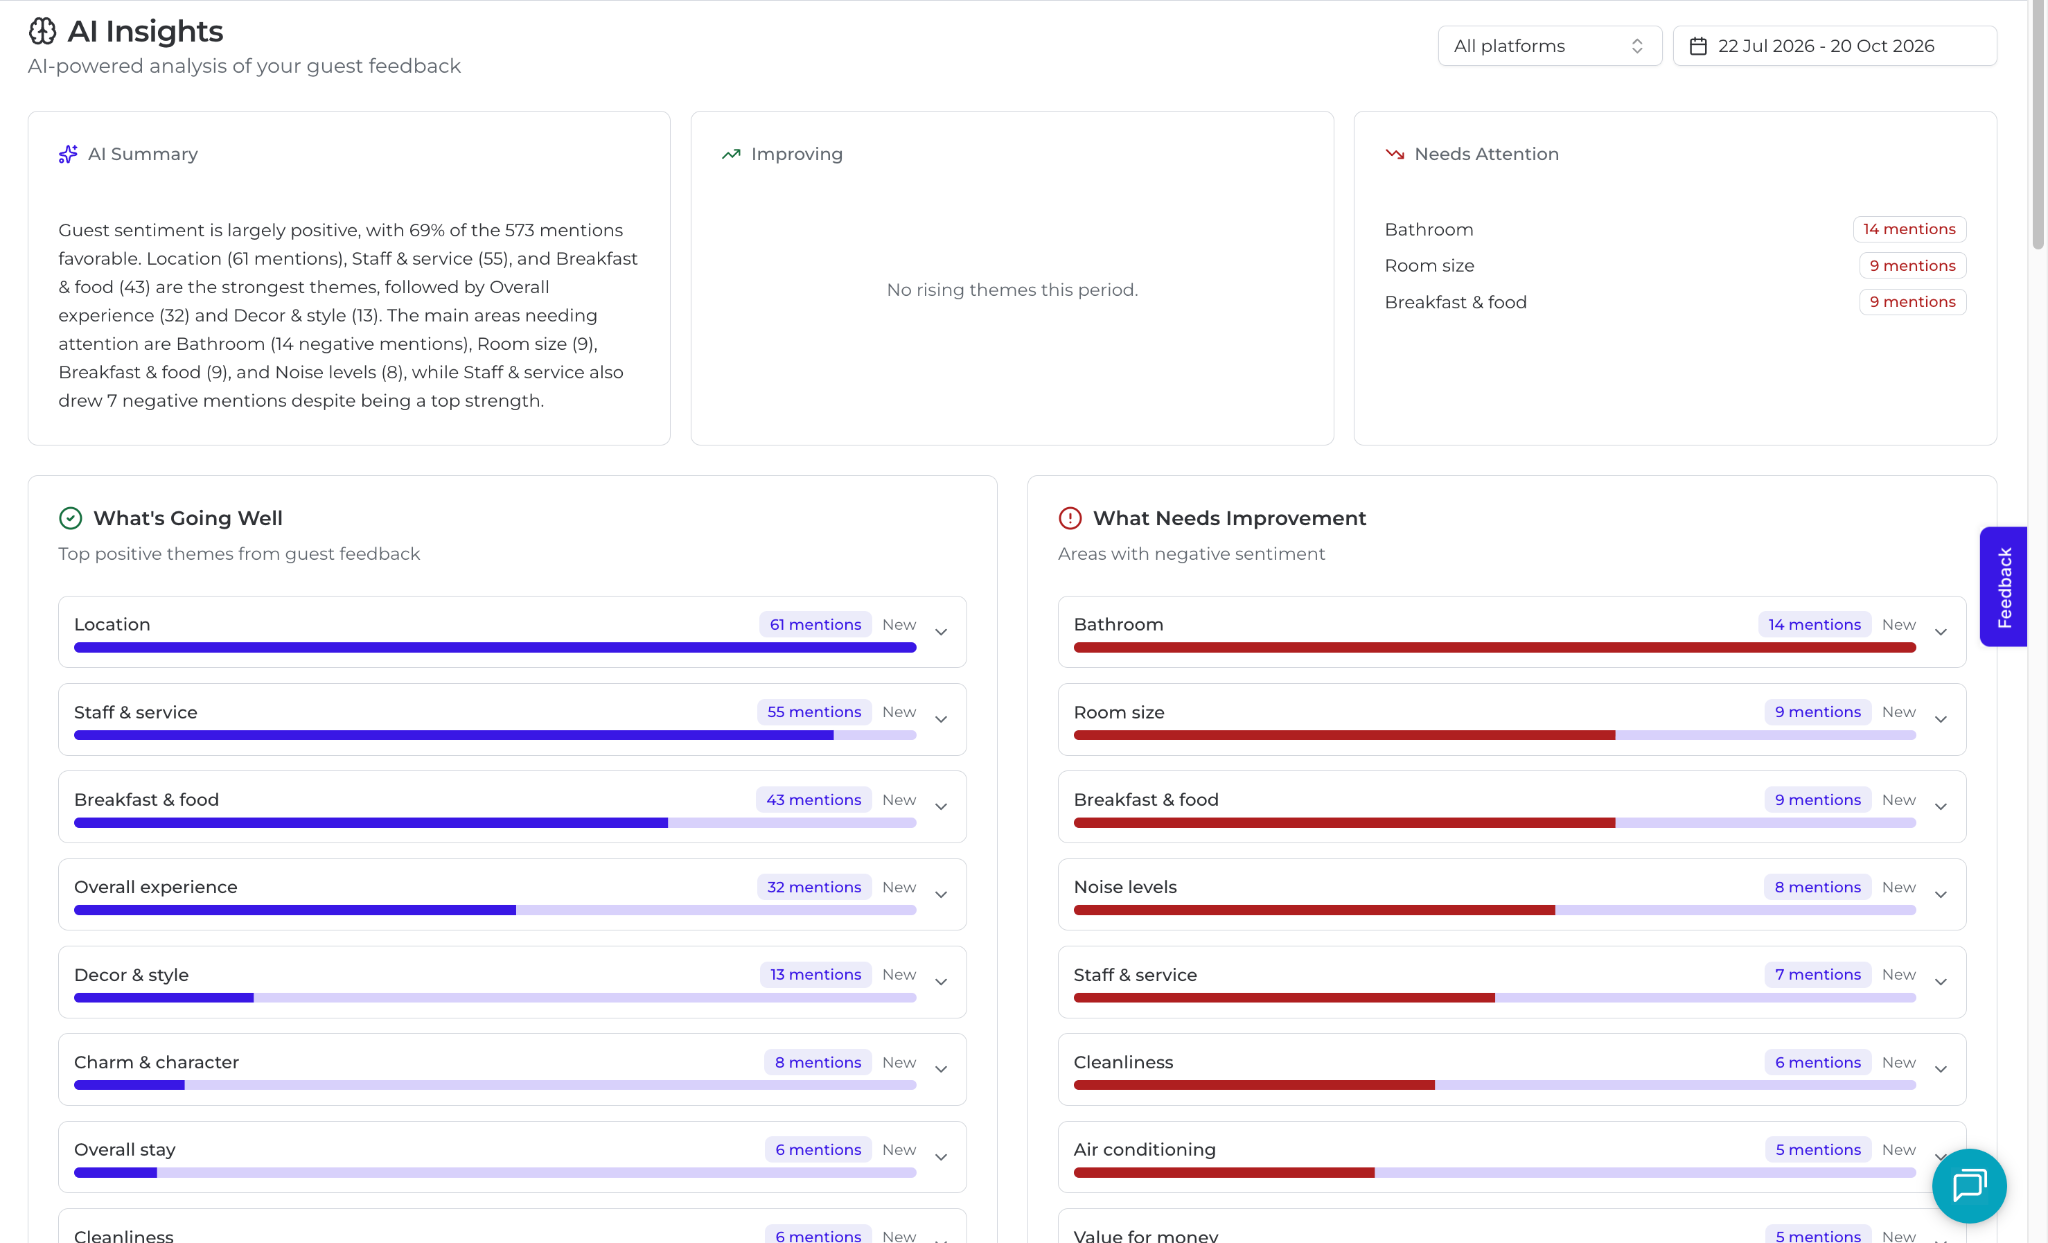
The first move is by theme. Instead of reading comments one at a time, recurring topics get grouped and counted, so "breakfast," "check-in wait," or "noise" stop being vague impressions and become numbers: how often each one comes up, whether its sentiment is positive or negative, and what can be done about it. The reason behind your score becomes as trackable as the score itself, organized by department, by service, or by a specific initiative, instead of arriving as a pile of individual comments.
At Customer Alliance, AI Insights supports this type of analysis. It uses AI to analyse open-text guest feedback at scale, grouping comments into recurring topics and sentiment so teams can see which themes are appearing, how guests feel about them, and how those patterns change over time. Hotels can also create custom categories to track topics related to specific departments, services, or initiatives.
The second move is to understand what actually drives the score. Of everything guests mention, which reasons are actually having the strongest relationship with overall satisfaction? Not every theme matters equally. Breakfast might come up constantly and barely affect whether guests recommend you, while a slow check-in that guests mention less often could be much more closely linked to a lower score. Looking at frequency alone tells you what is loud. Looking at impact tells you what deserves priority.
At Customer Alliance, Key Driver Analysis (KDA) supports this type of analysis. It measures the statistical relationship between different areas of the guest experience and overall satisfaction, helping hotels identify which themes are most strongly associated with the score. This makes it easier to prioritise the issues most likely to influence the result, rather than simply focusing on the topics that appear most often.

The clearest way to see this in practice is with NPS.
For years, NPS was a clean boardroom number that could tell you loyalty was slipping, but never why. Pair that same NPS with the themes behind it, and a falling score stops being just a falling score: it becomes a score falling alongside issues such as a slow check-in.
The number is the alarm. The reason points you toward the cause. Read them together every time: the number tells you where to look, the reason tells you what you're looking at, and the trend tells you how urgent it is.
This is how a guest feedback intelligence platform helps improve both performance metrics and the guest experience: it shows which issue sits behind a falling score, the team fixes it, and the next round of reviews and surveys shows whether the score and sentiment recover.
A complete metrics set has two halves, the what and the why, read together rather than in isolation, checked against direction, source, and competitor comparison, and built to work at every level of your organization at once. Get that right, and a falling score stops being a mystery. It becomes a specific, fixable reason, caught early enough to matter.
To see how these metrics look for your own property, the numbers and the reasons behind them, benchmarked and read together, book a demo to see Customer Alliance in action and how it could fit your hotel's operations.
They help hotels improve by linking each score to the reasons behind it. A feedback intelligence platform brings reviews and surveys into one place, uses AI to group guest comments into themes and sentiment, and shows which themes are most closely tied to overall satisfaction. Teams can then fix the issues that matter most, track whether scores respond, and compare results across properties and competitors.
CSAT measures satisfaction with a specific stay or interaction, NPS measures loyalty and likelihood to recommend, and CES measures how much effort a guest had to put in to get what they needed. CES is especially useful for spotting friction in specific moments, since guests are less likely to return to a property that made things difficult.
An average score is a lagging, blended number that moves slowly and hides the detail behind it. Reading it alongside its direction, its source, and a comparison against competitors, and pairing it with the themes driving it, is what turns it from a headline into something actionable.
A lagging indicator, like average score or sentiment, tells you what already happened. A leading indicator, like the velocity of a recurring theme, moves before the score does, giving you a chance to act while the issue is still small and changeable.
If a metric looks different at the property level than it does at the regional or executive level, people stop trusting the data and drift back to gut feel. Reliable measurement means one truth that rolls up to a boardroom trend line and drills down to a single property without contradicting itself.
By reading the recurring themes in your reviews and surveys alongside the number, and using a method like Key Driver Analysis to check which of those themes has the strongest statistical link to your overall satisfaction. That turns a falling score from an alarm into a specific, fixable cause, such as a falling NPS traced to a slow check-in.

Choosing a reputation management software becomes more complex as a hotel portfolio grows.
With multiple properties, regions, teams, review portals, surveys, and systems involved, the question is no longer simply whether a platform can collect and respond to feedback. It also needs to give teams a consistent view across the portfolio, while still making it possible to understand what is happening at individual properties.
So what should hotel groups actually look for when comparing platforms?
In this article, we break down six criteria that matter when evaluating guest feedback management software, from review coverage and integrations to multi-property reporting and the ability to identify what is really driving guest satisfaction.
Centralized reputation management software gives large hotel chains one view of guest feedback across the whole portfolio, visibility into which properties are struggling and which issues repeat across locations, and central oversight that still lets each property manage and respond to its own reviews. For a chain running 50 properties across 7 review portals, that's the difference between reading every review one at a time and seeing the whole portfolio at a glance.
Without that layer, feedback stays fragmented across portals, surveys, and teams, and patterns that are obvious at the portfolio level get missed at the property level: a cleanliness complaint recurring at three hotels in the same region, for instance, or guest expectations that differ noticeably from one market to the next. Centralized reporting surfaces those patterns for head office, while each property keeps owning its own response.
What centralized reputation management software does for a hotel chain:
Dorint Hotels & Resorts is a working example of this in practice: it manages guest feedback across nearly 60 hotels on Customer Alliance, giving headquarters portfolio-wide visibility while each property still handles its own guest responses and local follow-up. See how Dorint runs its feedback program across the group.
Work through these six criteria in order. Each one is a capability a portfolio specifically needs, and each one is something Customer Alliance was built around.
Confirm the software pulls reviews from every portal that matters to your portfolio, including region-specific ones like HolidayCheck where a meaningful share of guests actually leave reviews, not just Google and Expedia, for example.
Guest feedback isn't only public reviews: check that the software also runs CSAT, NPS, and CES surveys at key moments in the guest journey, not just an email review request.
Ask for a live demo of AI-generated replies and check whether they hold a consistent brand voice across different properties and languages, not a generic template.
Reporting needs to be scoped by level: HQ sees the whole portfolio, a regional manager sees their cluster, and a GM sees their own property, while still letting you drill from a portfolio average down to the property behind it. Ask how granular that access actually gets, and how many steps it takes to go from a portfolio number to a specific property; a flat, one-size-fits-all view won't tell you which property needs help.
Check that the software connects to your existing PMS and CRM to automate guest-data syncs and trigger surveys on stay events, rather than requiring manual list uploads. Customer Alliance offers 100+ integrations with PMS, CRM, and revenue systems, connecting via OAuth or API-key exchange.
Ask whether the software can rank which feedback topics most influence your satisfaction score and confirm whether a specific operational change, a renovation, a new breakfast supplier, a staffing change, actually moved the number. This is where Customer Alliance's Key Driver Analysis and AI Insights go furthest: software that only collects and organizes feedback is managing it; Customer Alliance ranks what to fix first and proves whether it worked, which is what makes it a guest feedback intelligence platform rather than a review-management tool.
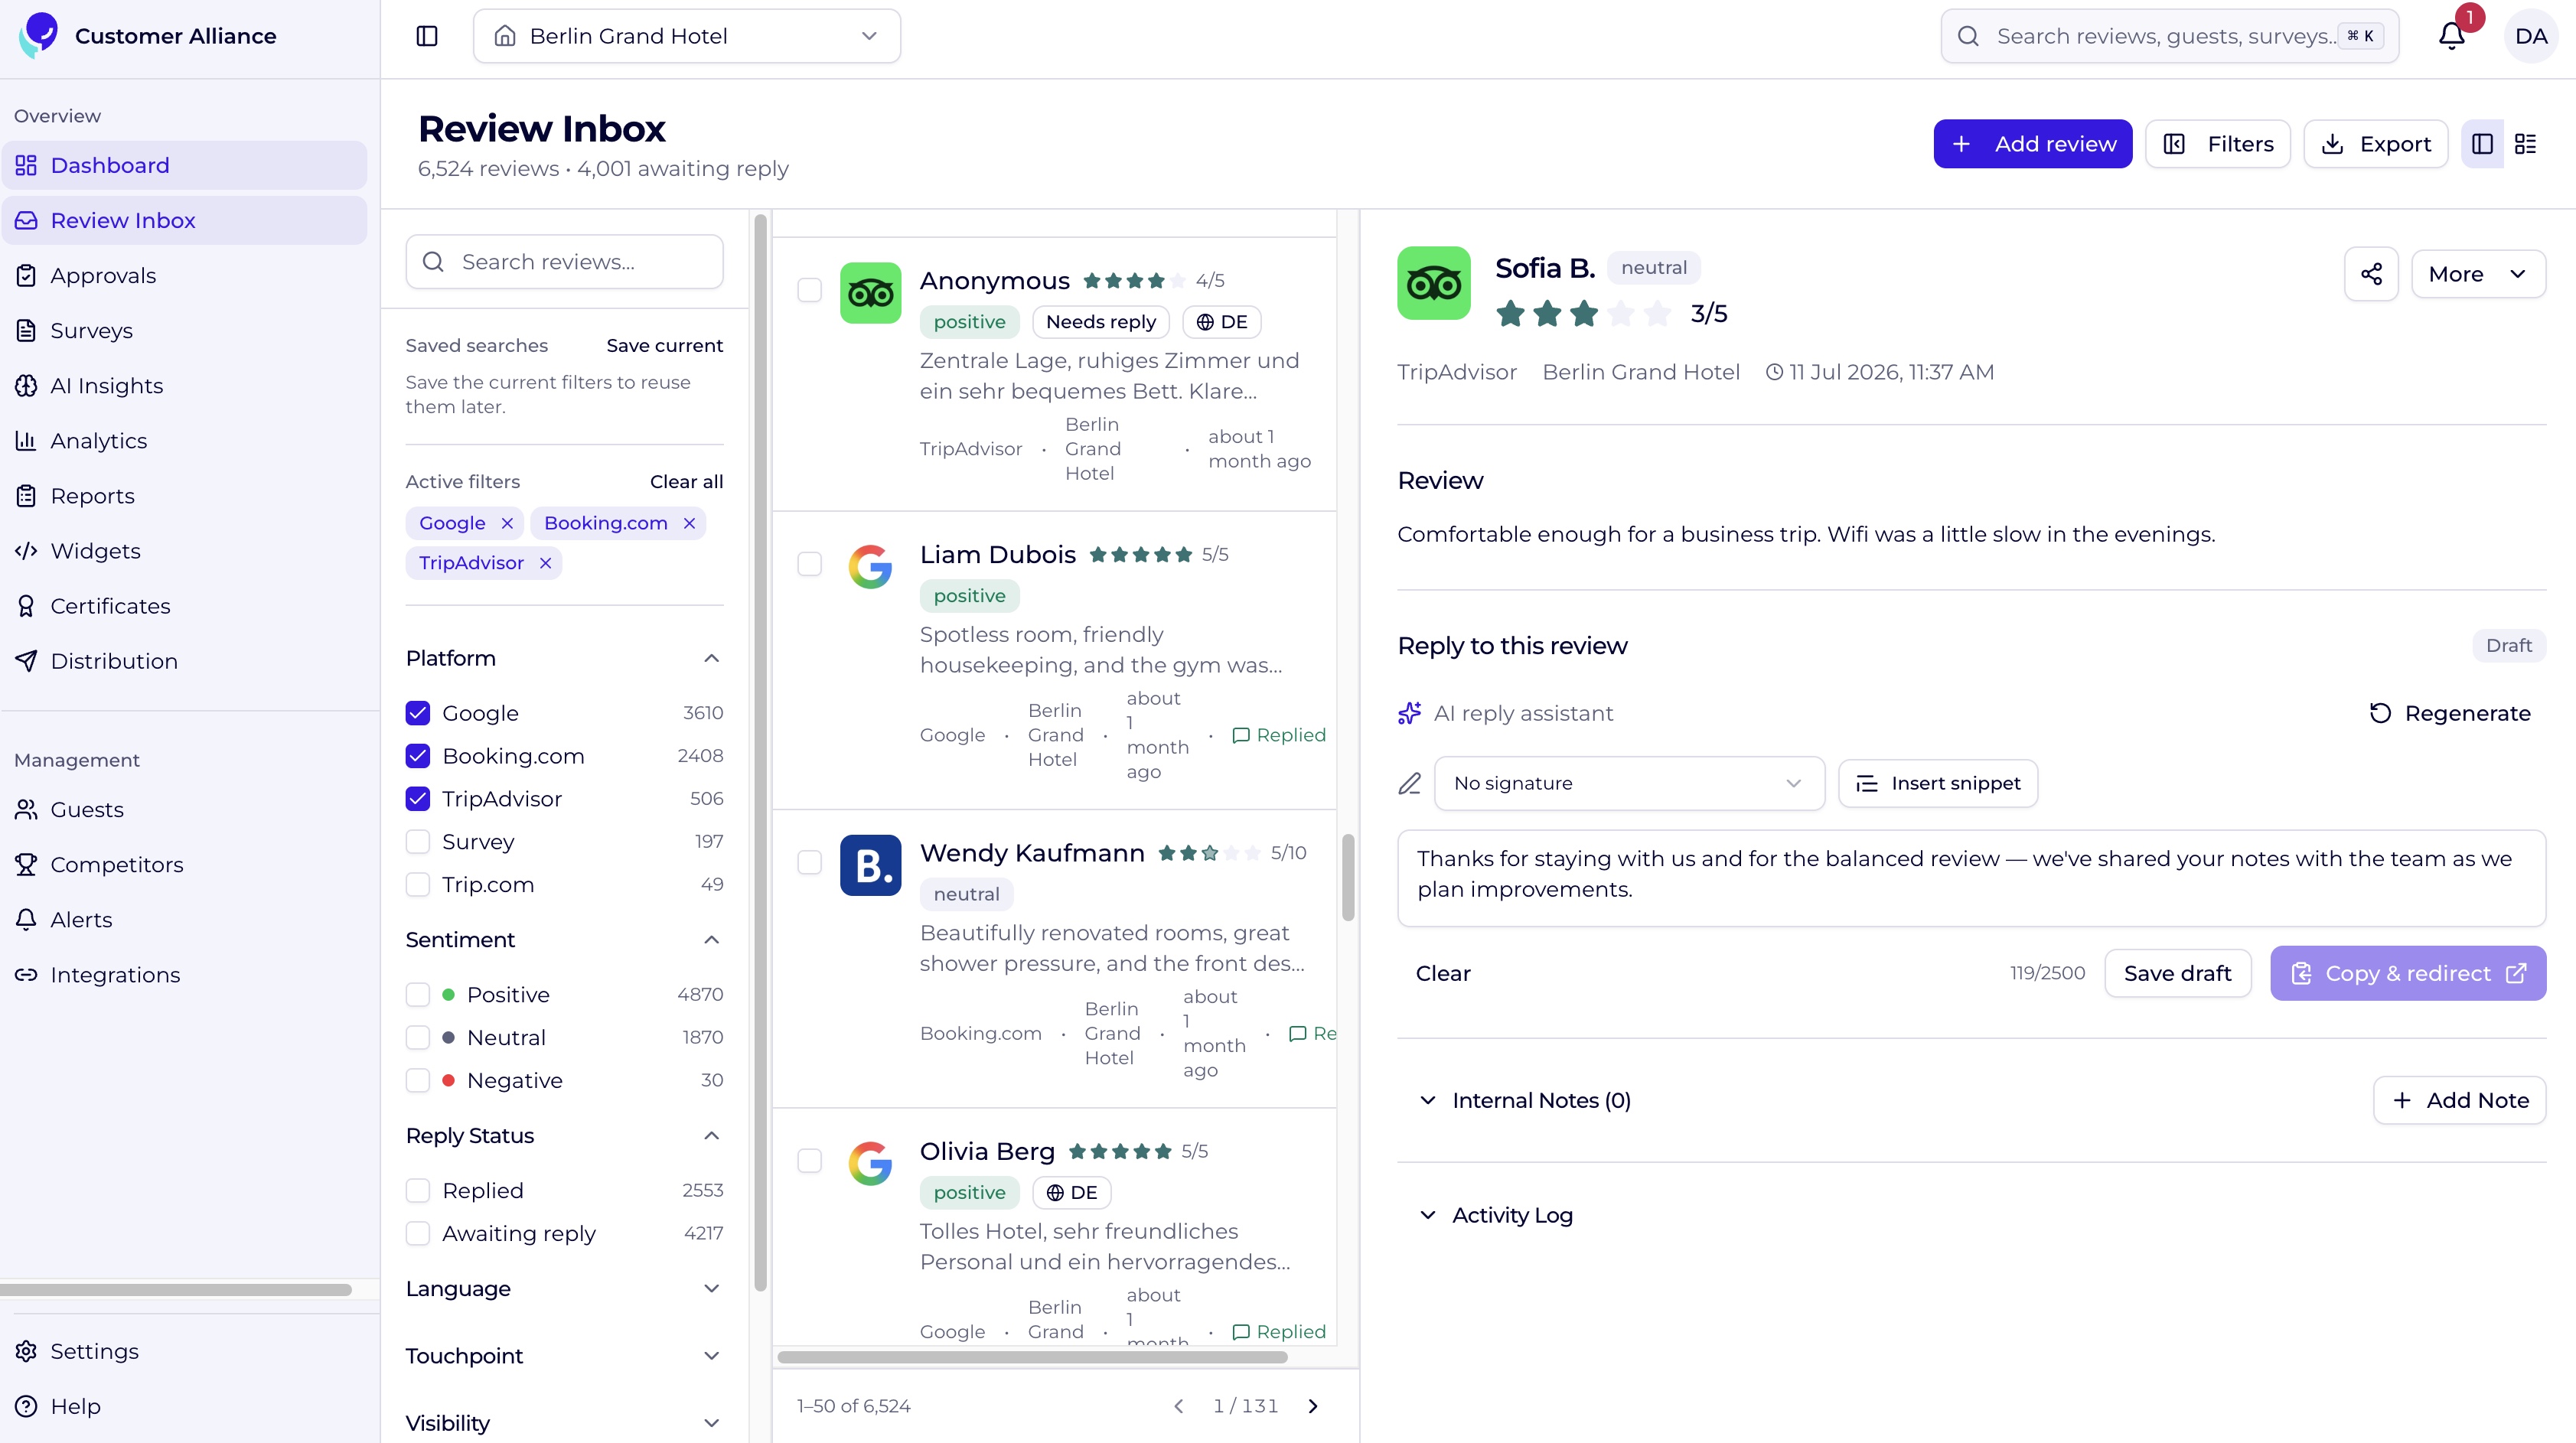
In practice, this runs as one workflow. Reviews and completed surveys land in a single inbox, filterable by portal, property, date, or sentiment; the AI Reply Assistant drafts a reply in the hotel's Brand Voice, which staff edit and send, posting directly on connected portals or copying to clipboard for the rest. Surveys trigger automatically off PMS stay events.
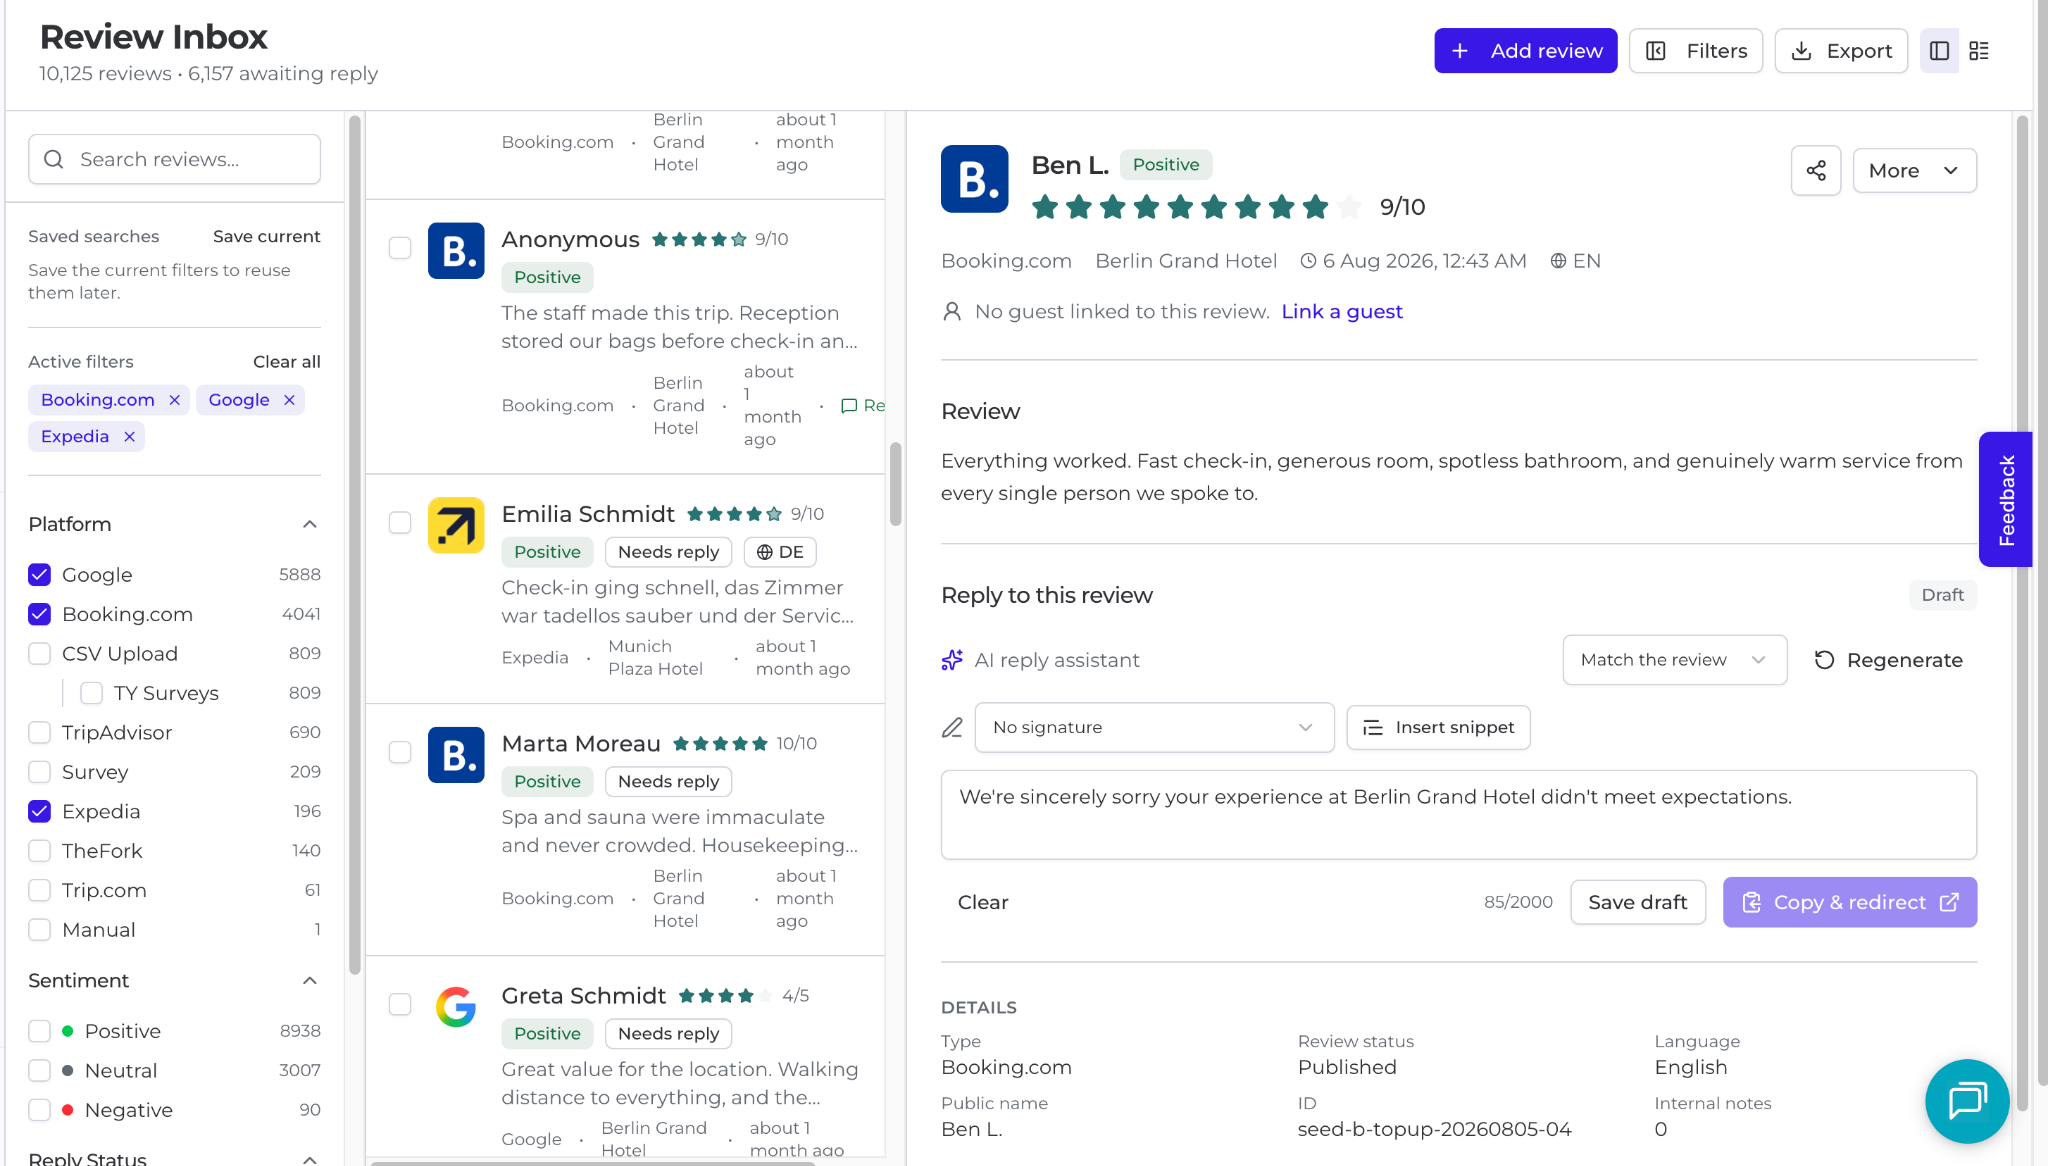
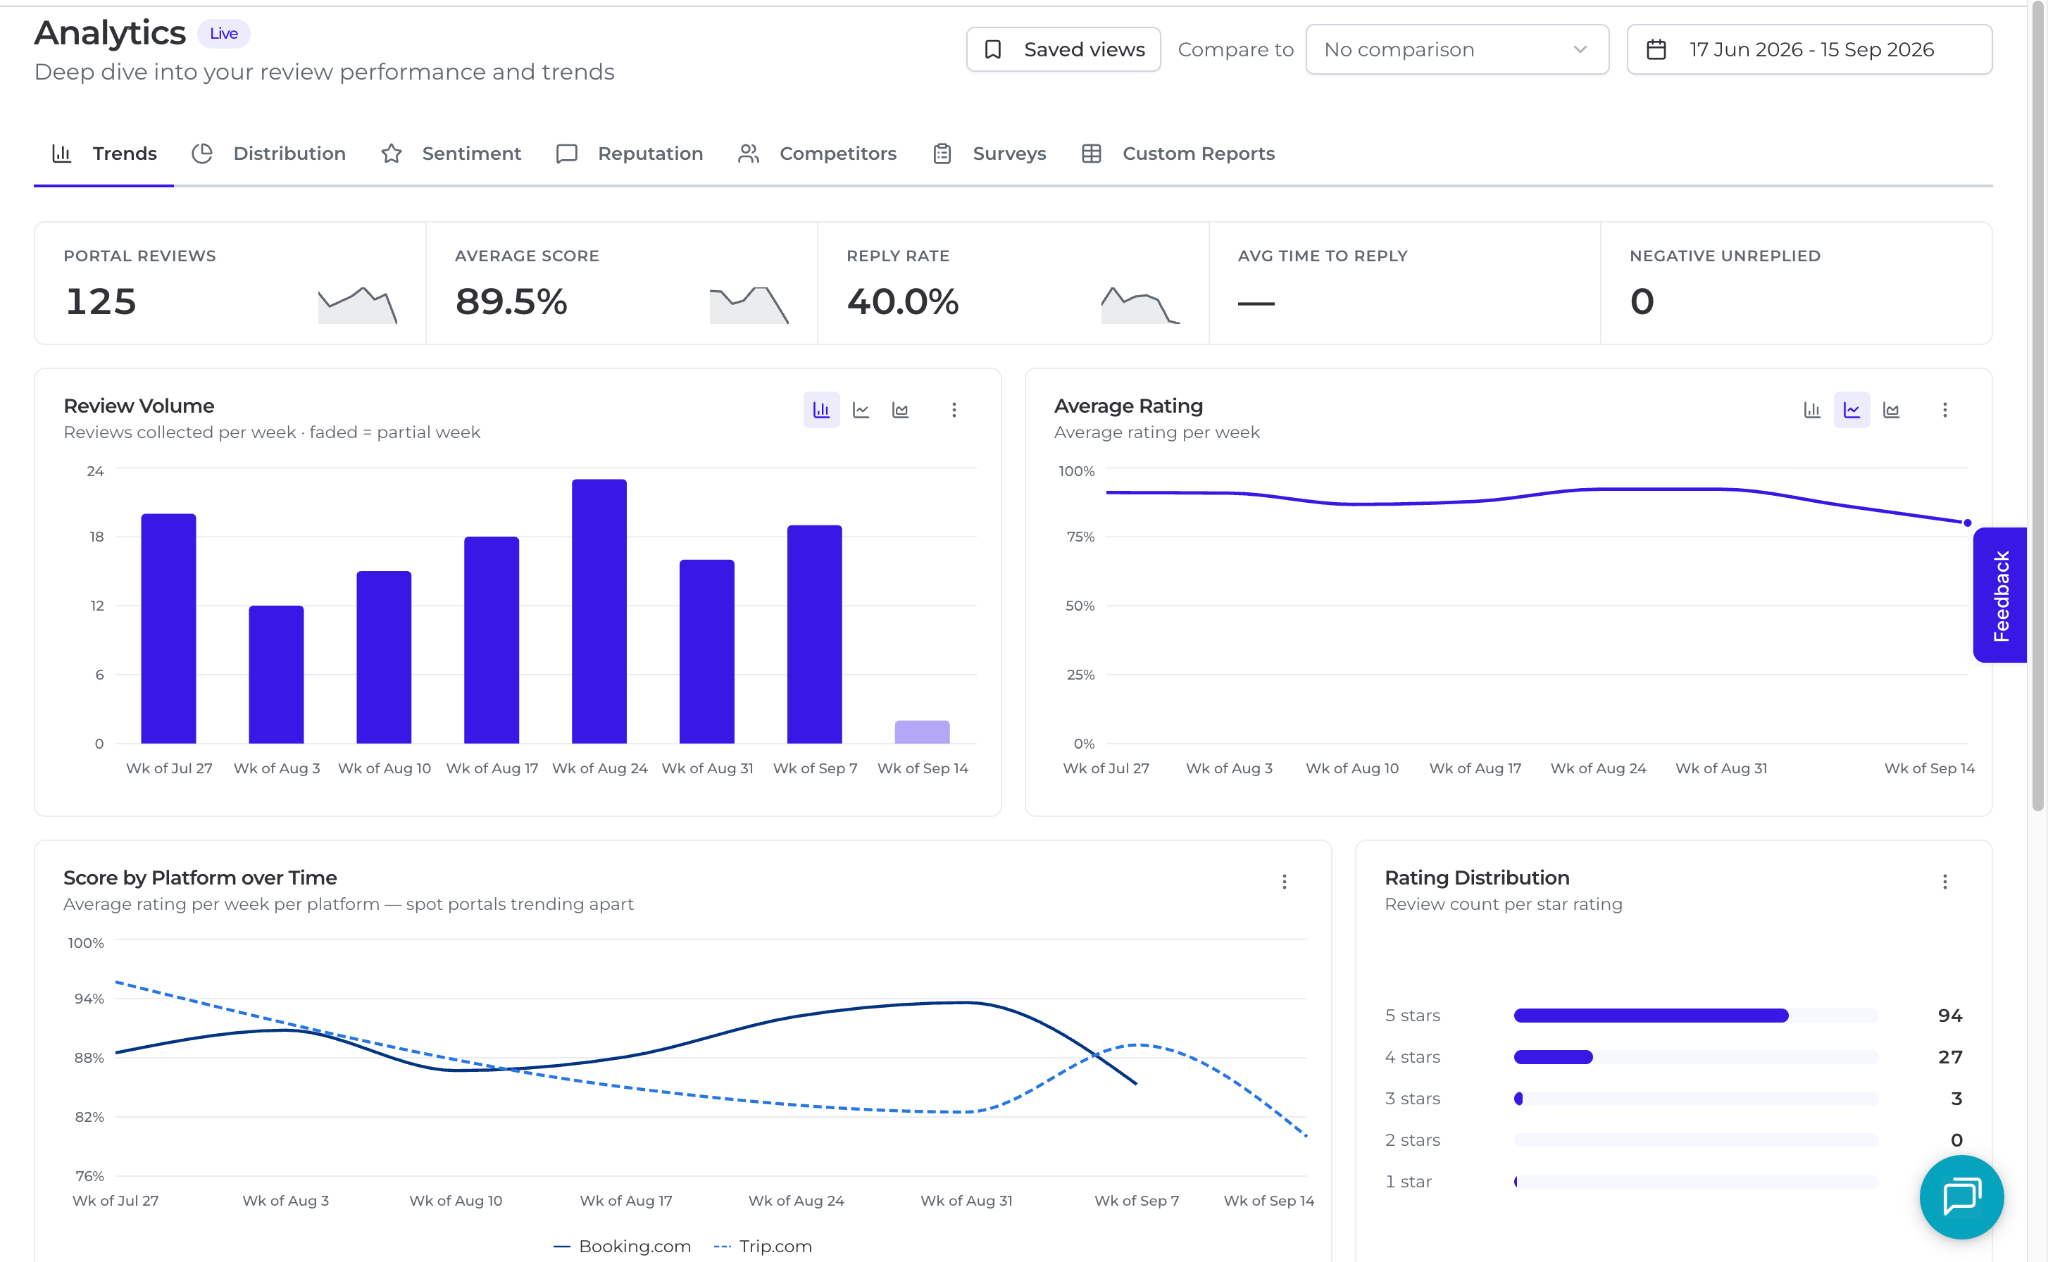
Reporting rolls up to whichever level of the portfolio you're looking at: HQ, a region, or a single property, rather than adding a new sub-menu every time a metric gets added. Trends, per-portal breakdowns, sentiment, competitor benchmarking, and survey performance sit in the same window, with core tiles: total reviews, average score, reply rate, average time to reply, and unreplied negative reviews you can click straight into, always visible alongside them. Because not every hotel group tracks the same things, you can also build a custom pivot table or chart from the underlying data and save it alongside the built-in dashboards, or schedule any view as a PDF report for stakeholders who don't log in.
Underneath all of it, AI Insights reads every open-text review and survey comment to surface what's going well and what needs improvement, and Key Driver Analysis ranks which of those topics actually moves the score.
Early results on Customer Alliance show satisfaction scores and review visibility moving together.
Preston Palace saw a 14% rise in cleanliness satisfaction after using guest feedback data to prioritize a renovation; My Arbor grew its Google reviews by 55%; and Gorki Apartments reached #1 on TripAdvisor in Berlin with a 12% review-score gain in six months. At the portfolio level, Dorint Hotels & Resorts manages guest feedback across nearly 60 hotels on Customer Alliance, giving headquarters a single, consistent view instead of 60 separate ones.
Working through all six criteria: coverage, multichannel capture, response automation, multi-property reporting, integrations, and diagnostic intelligence, surfaces which platforms actually hold up at portfolio scale before a bad rollout costs you time and budget.
For hotel groups and chains specifically, the Customer Alliance platform is built around this exact shortlist: group-level insight with local-level action.
Ready to run your own shortlist against it? Book a demo and see how it stacks up for your portfolio.
Guest Feedback Intelligence is the approach of bringing together everything your guests say, across different OTAs, languages, and time, and turning it into structured, shared, and actionable understanding across your entire operation. It brings feedback from across different portals into one view, organises it at scale, and enables teams to respond, identify patterns, prioritise actions, and make decisions based on what guests are consistently experiencing. It is a way of treating guest feedback not as individual comments, but as a continuous source of visibility, reputation, and insight that informs how the hotel operates and improves.
Yes. Customer Alliance combines review and portal coverage, multichannel surveys, AI-generated brand-voice replies, multi-property reporting and permissions, 100+ integrations, and AI Insights in one platform, and is used by hotel groups.
Prioritize six features: coverage of every review portal your guests actually use, not just Google and Expedia; multichannel capture through CSAT, NPS, and CES surveys; AI-generated replies that hold a consistent brand voice across properties and languages; multi-property reporting you can drill from a portfolio average down to a single hotel; integrations with your PMS and CRM; and diagnostic intelligence that ranks which issues are actually driving your satisfaction score. Most tools stop at collecting and organizing feedback. The last one is what turns a review tool into a guest feedback intelligence platform.
Review management for hotel chains has to add multi-property permissions, portfolio-wide reporting, and consistent brand voice across every location on top of monitoring and responding to reviews. Customer Alliance is built around those requirements, with Dorint Hotels & Resorts managing nearly 60 hotels on one account as an example.
Review scores and volume influence ranking and visibility on OTAs and in search, which affects both indirect and direct bookings. Beyond visibility, a stronger, well-managed reputation increases traveler confidence at the point of booking — which is why Customer Alliance customers like Gorki Apartments and My Arbor have seen both review-score gains and stronger booking-related outcomes after closing the loop from feedback to action.
The new Customer Alliance platform brings guest feedback intelligence to hotels. It's an AI-first platform that unifies reviews, surveys, and direct feedback in one place, helping teams capture, understand, and act on guest feedback to improve the guest experience, reputation, and revenue. Great hotels already run on great systems that keep the operation moving; guest feedback is what connects all of that to the people it's for, your guests, showing you what's working, what to improve next, and what keeps them coming back.
💡Want to see how the new platform could work for your hotel? Book a demo and our team will walk you through the platform, answer your questions, and show you how it can support your guest feedback strategy.
The Customer Alliance platform is an AI-first guest feedback intelligence platform for hotels, built by Customer Alliance and trusted by more than 5,000 hotels worldwide. It brings reviews, surveys, and direct feedback into one place, helping hotels capture, understand, share, and act on guest feedback, and it combines review management across major portals with customized CSAT and NPS surveys, AI Insights, and analytics. To date it has processed over 3 million guest surveys and collected more than 90 million reviews, delivering insights to the teams that need them through 100+ integrations with PMS, CRM, and revenue systems.
AI has changed how hotels compete and make decisions, and that makes structured guest feedback more valuable than ever. It can no longer sit in scattered review portals, spreadsheets, and isolated reports, read one comment at a time.
So we rebuilt the platform on an AI-first foundation and improved every core feature, from review collection and replies to surveys, based on what our customers asked for. It now makes guest feedback easy to structure, understand, and act on across a hotel's teams and tools, and it's ready to support whatever they build next.
"Guest feedback is nothing new; hotels have always had it. The real question is how AI can transform that feedback into insights, priorities, actions, and measurable improvements. That's what we mean by guest feedback intelligence: not just collecting reviews and surveys, but making sense of them so hotels know where to focus and what to do next," said Steffen Schmickler, CEO of Customer Alliance.
The platform runs one connected cycle: capture, understand, share, and act, so a hotel can move from only collecting feedback to also acting on it. Two lenses sit at the centre of that cycle: an evaluative lens that judges whether operations are landing, and a diagnostic lens that ranks what to fix next.
The evaluative lens answers "did it work?" When a property changes its breakfast buffet, the only way to know whether the change actually landed with guests is to track their satisfaction quarter over quarter against the date it happened. It's exactly how Preston Palace confirmed the impact of refreshing its restaurant, helping lift breakfast satisfaction to around 9.0 out of 10. That is how a GM proves to ownership that an investment paid off, or learns quietly that it did not.
The diagnostic lens answers "what should we fix first?" No hotel can fix everything, so the value is in the ranking. Key Driver Analysis can show that staff friendliness is already excellent with little room to move the score, while room quietness is mediocre and one of the strongest drivers of satisfaction, redirecting the next investment to where it actually returns.
The new Customer Alliance platform includes a review inbox, a survey builder, AI Insights with Key Driver Analysis, a consolidated analytics view, reports, website widgets, and a dedicated integrations area. The reputation management essentials (review collection, replies, and surveys) have been refined with input from hoteliers, and together these bring every stage of the feedback cycle into one workspace. Below is a walkthrough of each area, in the order feedback flows through it.

The dashboard gives you an immediate, high-level snapshot of guest satisfaction across a single property or your whole portfolio. A global date filter in the top right: Last 7, 30, or 90 days, or a custom range, updates every metric on the page at once.
The Review Inbox is a live, unified feed of reviews from third-party portals alongside completed guest surveys. A filter bar lets you isolate feedback by platform, date, score, sentiment, or reply status, so you focus on what matters right now.
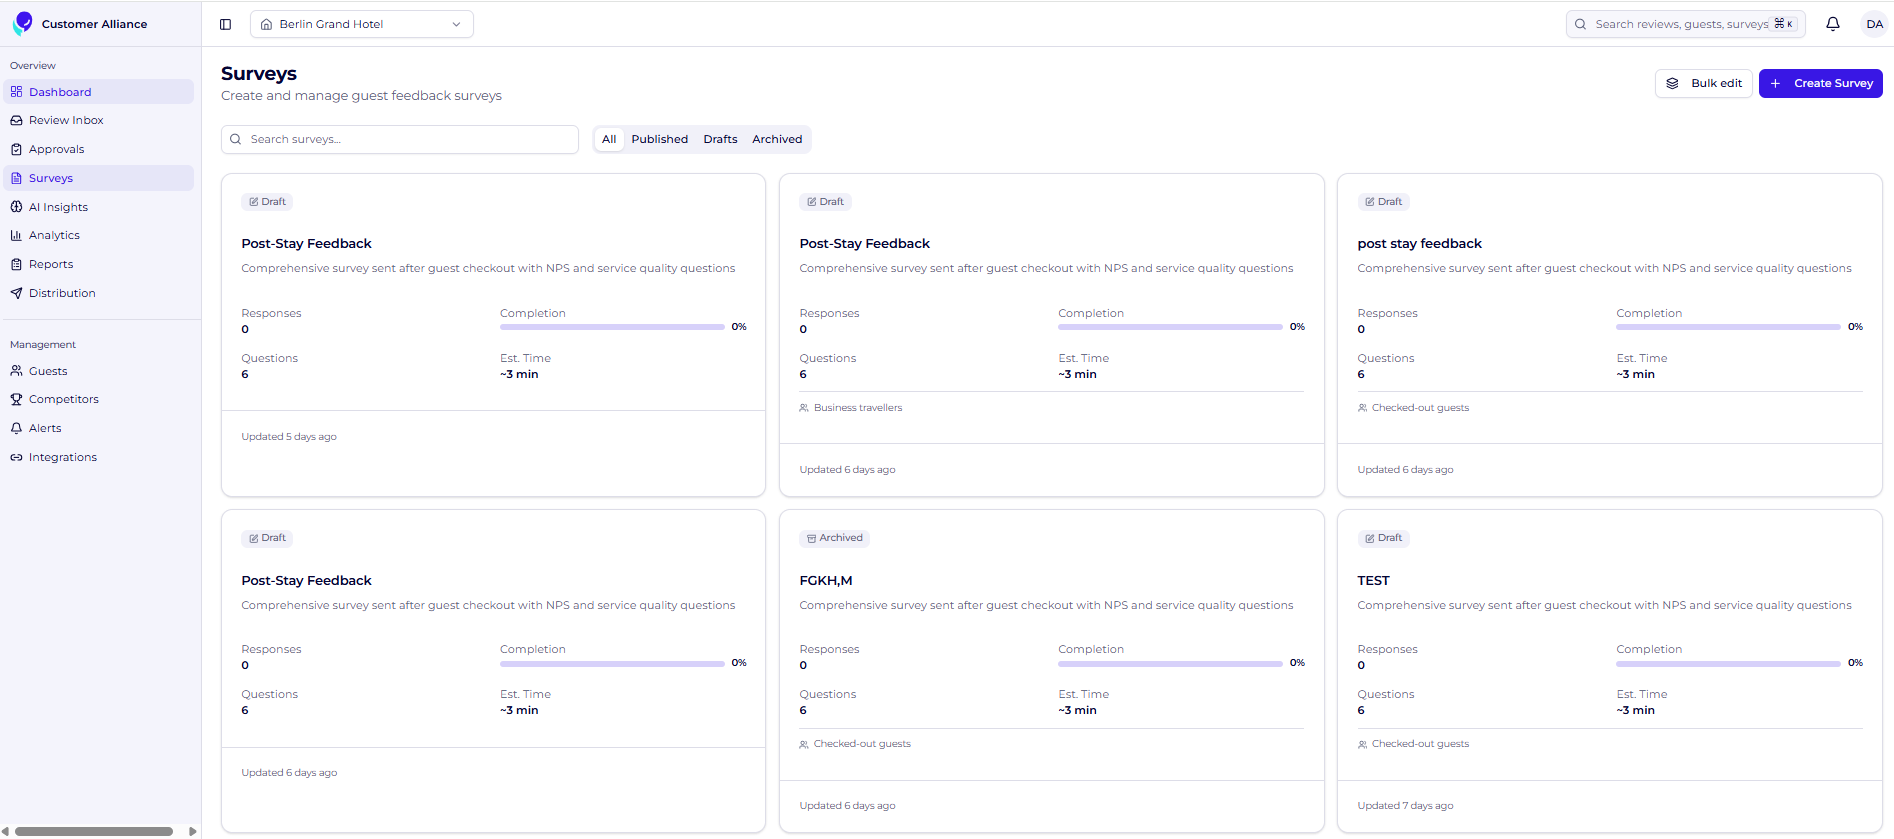
The redesigned, drag-and-drop survey builder lets you ask guests about the moments that shape their stay and send surveys to targeted audiences. Distribute them by automated email or a static link in QR codes, digital signage, or your Wi-Fi login page.
Distribution is where you build, send, and monitor the campaigns that get your surveys in front of guests at the right moment. Using data from your PMS integration, you can segment your audience and reach guests before they arrive, during their stay, or after they check out.

Inside the new Customer Alliance platform you find the Analytics area, where hoteliers can drill into specific data points. The top cards mirror your home dashboard, and a global date filter updates four specialised sub-dashboards at once.

AI Insights reads across all your open-text reviews and survey comments and synthesises thousands of guest words into clear, actionable themes, so you stop reading feedback one review at a time.
Key Driver Analysis identifies the exact levers that move your overall satisfaction most, measuring not just what guests talk about, but how heavily each topic influences their final score. If breakfast is a primary negative driver, it can pinpoint whether food temperature or service speed will yield the biggest rating increase once resolved, so you invest where it matters.
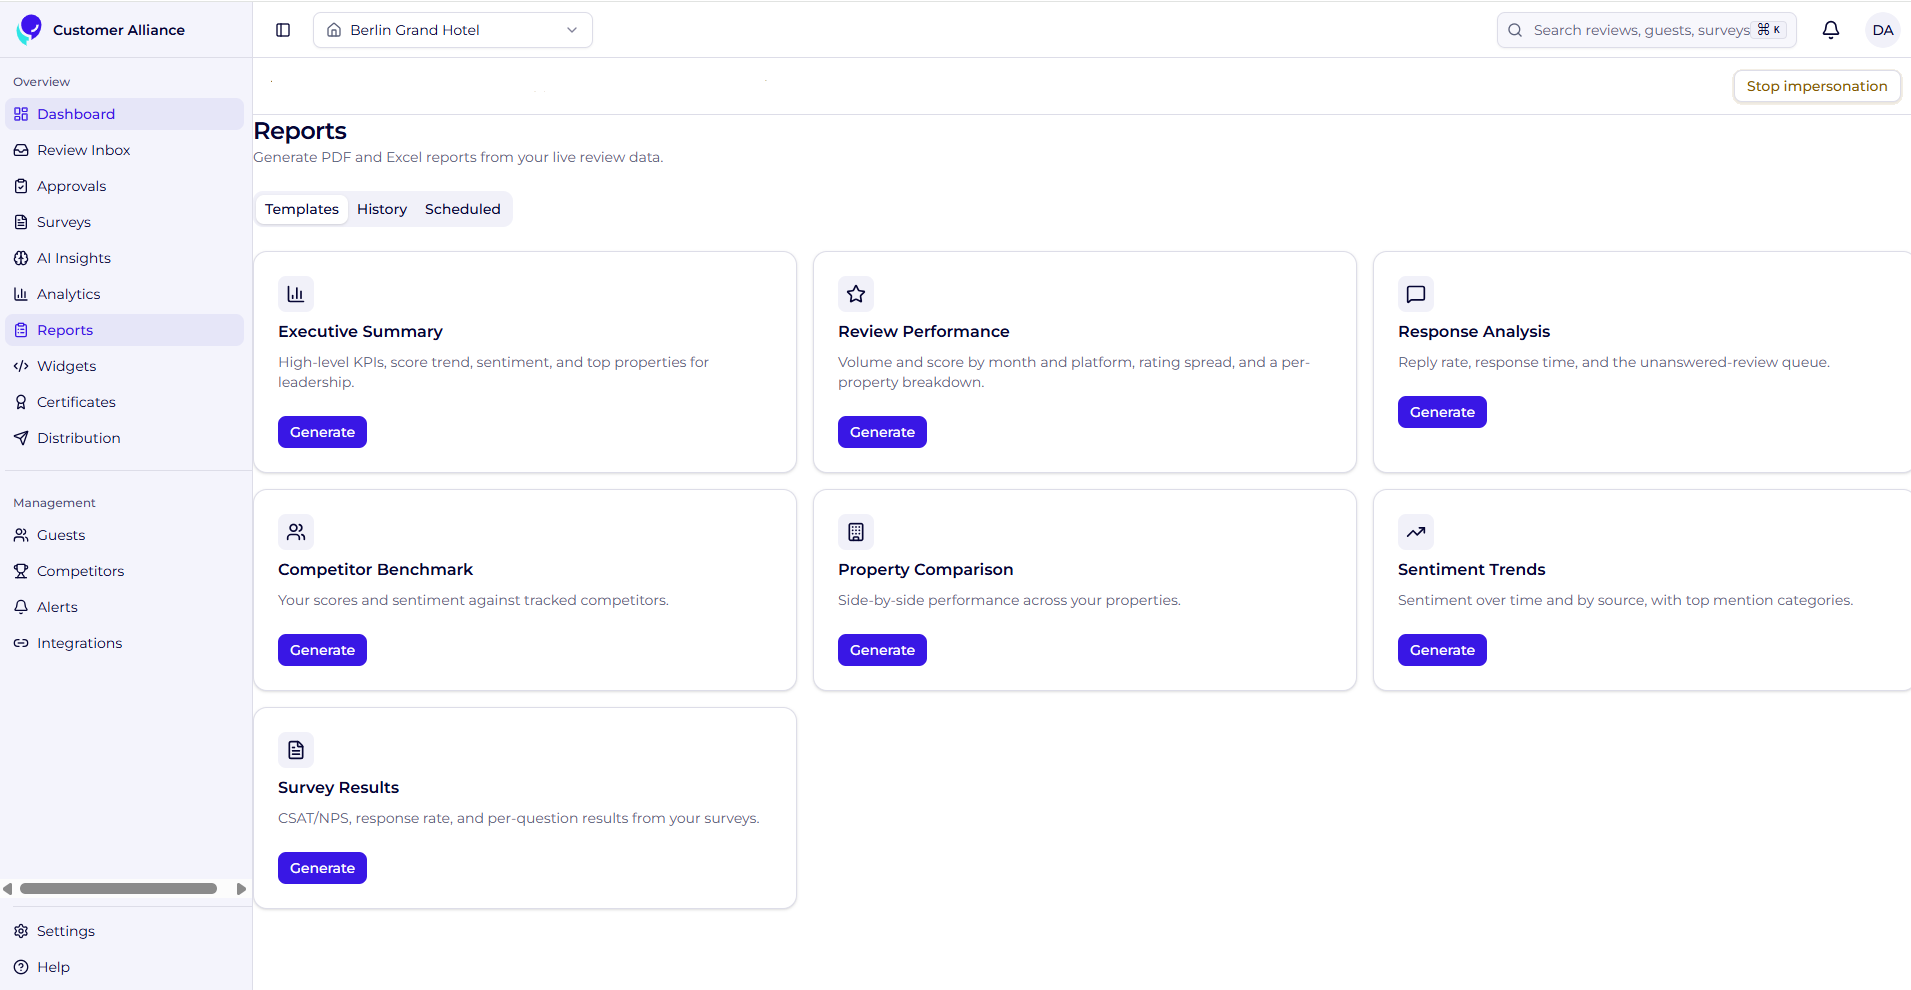
Reports export clean, professional PDFs for leadership, stakeholders, and teammates who don't log in. Use built-in templates (previewable before you generate), or build a custom report by selecting the exact modules and charts you need. The Schedule tab automates recurring delivery to stakeholder inboxes, and the History tab keeps an audit log of what was sent and to whom.
Website widgets are floating JavaScript elements that display live review scores and guest feedback on your site as social proof. Choose a simple rating badge or a review carousel, then hand the generated code to your webmaster, or use the API for a fully custom, brand-matched widget.

The Integrations area is the central hub for connecting your digital ecosystem, so guest feedback flows into the tools your team already uses.
The Customer Alliance platform is built for hotels, and grounded in the reality of how hoteliers actually work. It gives the people who own the guest experience (general managers, cluster and regional managers, and revenue teams) a single shared view of guest feedback, each reading it through the lens that matters to their role rather than working from separate reports.
It works the same way whether you run one property or hundreds. Independent hotels, hotel groups and chains, and hotel management companies all use Customer Alliance to keep standards consistent and ground their decisions in what guests actually experience, Dorint Hotels & Resorts, for example, manages guest feedback across nearly 60 hotels on the Customer Alliance platform.
For general managers, that means fewer fire drills and proof that operational changes landed with guests. For cluster and regional managers, it means portfolio-wide benchmarking and consistent reporting across properties. For revenue and commercial teams, it means a clearer read on the experience signals that shape reputation, visibility, and booking confidence.
Your systems keep the hotel running and show you what happened. Customer Alliance's new platform is built to show you how it landed with the guest, what to focus on next, and whether the last change worked. That is the shift from managing reviews to guest feedback intelligence. Hotels investing in this layer now aren't just adding a feedback tool; they're building the layer that makes everything else in their stack more valuable.
Ready to see the new Customer Alliance? Book a demo and discover how the platform helps your team collect better feedback, understand what guests value, and prove where to focus next.
Guest feedback intelligence is the practice of bringing together everything guests say, across review portals, surveys, languages, and time and turning it into structured, shared, and actionable understanding across the whole hotel. Built on four pillars (capture, understand, share, and act), it lets a hotel see what guests are consistently experiencing, which issues matter most, and whether recent changes worked, rather than reading feedback one comment at a time.
Other review management tools tell you what guests said and help you reply. Customer Alliance tells you which issue to fix first, whether your last operational change moved the score, and how the guest experience is shaping reputation and bookings. That decision-making layer is what makes it hard to drop without returning to guesswork.
You can build surveys from a blank canvas or a template, using NPS, CSAT, CES, star and emoji ratings, text fields, and single- or multi-select questions. Conditional sub-questions let you trigger targeted follow-ups based on a guest's answer, and unlimited surveys are available on plans that include them.
Yes. The AI-first platform is available now to hotels and groups worldwide, and existing feedback workflows; reputation management, review collection, replies, and surveys, remain core to it.
Yes. A dedicated Integrations area lets teams connect review portals, integrate a PMS and CRM, send alerts into Slack and Microsoft Teams, and access API keys and webhooks so feedback data can move wherever they work.

Customers expect an excellent experience both in-store and online. Even if your enterprise doesn’t have a physical store, the consumer experience is still a defining factor. The voice of the consumer is what your shoppers say about their experience with your brand. Use consumer feedback to put your shop in front of the competition.
Read on to see how you can harness the power of feedback to elevate your ecommerce shop.
Voice of the customer, also called voice of the consumer, is now the leading way to understand your customer. Be proactive about asking for feedback. Let consumers tell you what they want and need to remove the guesswork from discovering their desires. To review, see The Voice of the Customer Guide: Importance, VoC tools and examples.
89% of consumers worldwide make the effort to read reviews before buying a product (1).
This stat alone reveals how influential the voice of the consumer is to other potential consumers. What others have to say about your products often provides more value and trust to your brand than what you have to say about your own shop.
Investigate what is being said about your company. If it’s good, use it to promote. If not, use the feedback to improve. Let’s dive into how you can collect this feedback.
The opportunities for feedback collection are plentiful. Consider these ways to capture your voice of the consumer data.
Send out a questionnaire to ask for feedback regarding different stages of the customer journey.
You can also send out questionnaires to loyal customers to test out new concepts. For more examples, see 5 ways to use the new questionnaire that you haven’t thought of yet!.
Just because your shop operates online does not discount the importance of interviews. Interviews offer a great way to obtain the raw, unfiltered voice of the consumer data and it will build trust with those whom you interview.
Conduct the interview over the phone or even by email at the convenience of your client. Make sure to ask them if you can record the interview and even use them on your website for customer quotes.
Our suggestion: Don’t wait and simply hope customers leave reviews. Why?
Your customers are much more willing to give reviews than you think:
76% of consumers will leave a review if asked (2).
So don’t be shy. Why not automate a review invitation after every purchase? There are many providers offering this solution.
These online reviews will provide valuable insight on what you consumers think about your brand, their customer journey and your products/services. See this article: 5 reasons to use a tool to manage reviews for your online store.
If you have the capabilities, use live chat to talk to customers when they’re on your site. They’ll love the convenience of a quick answer and will find their purchasing made easier as they could quickly get an answer to their question.
Additionally, to reduce cart abandonment, consider putting a live chat on your checkout page or pricing page.
We believe the above tools are the best to help ecommerce sites gather the voice of the consumer feedback. Check out Voice of the Customer Tools to Improve Customer Experience for a few more techniques to look into.
Show you care by taking reviews seriously. Many customers find that brands don’t respond to their reviews at all and guess what? When you don’t respond to reviews, you risk increasing your customer churn by 15%. (3)
Respond well to negative feedback. And yes, consumers look for how a company responds to negative feedback. If you end up collecting a lot of reviews (as you should!), you’re bound to have a few negative ones. But you know what? That works to build trust. 30% of consumers will not believe your reviews to be real if you don’t have any negative ones (4).
Additionally, by responding quickly and appropriately, you might be able to convince a consumer to edit their rating or review of your shop and end up with another positive review.
Negative customer feedback is also always an opportunity to learn from the voice of the consumer. Perhaps they’ll enjoy your product overall, but mention a small pain point in a review or questionnaire. Fix it to increase sales and customer satisfaction.
Oh, and another thing we’ve heard to be helpful: Optimise product descriptions based on feedback. Then your consumers’ expectations are more likely to match your product or service. And then they’ll be happy, and likely loyal!
Improve your shop based on customers’ likes and dislikes. This goes beyond your company’s offerings, but also includes the customer experience:
Evolve whether it’s positive, neutral, or negative. Analyse the results and make actionable decisions.
As the ecommerce industry is online, it relies heavily on consumer reviews and ecommerce shops need quite a bit of reviews per product to drive revenue. Look:
Reviews of 50 or more per product can mean a 4.6% increase in conversion rates (4).
Increase your ecommerce shop’s conversion rate by using voice of the consumer data directly on your website. Many companies encourage purchasing by displaying consumer reviews.
For example, here at Customer Alliance, we offer a widget that clients can integrate on their website to display the customer feedback they receive.

Lastly, it’s important to distribute consumer feedback among various review portals to build your online presence. Make sure you have reviews on all relevant review platforms. By doing so, you’ll attract new consumers to your website.
In conclusion, investing in a voice of the consumer solution is an excellent step to building your ecommerce site’s online visibility and promoting customer trust.
Sources:
Related Content:
The Voice of the Customer survey for competitive customer insights
Hotel VoC: The key to guest satisfaction is voice of the customer
VoC Restaurant 101: Develop a Voice of the Customer Strategy

We’re so excited to announce the launch of in-app and in-web surveys! Also known as microsurveys, they offer a short, targeted and timely way to collect customer feedback right inside your website or app.
With lots of use cases and instant, actionable data, we can’t wait to see how microsurveys will get you even better results. But first, let’s dive in and learn more about this powerful feedback tool. Here we go!
Traditional surveys are multi-question or multi-page and are often sent to the customer via email. These types of surveys still hold tremendous value, providing deep insights that are key to any Voice of the Customer program.
But there are some instances where bigger isn’t necessarily better. Microsurveys are the perfect complement to traditional surveys, targeting the here and now of specific customer scenarios.
Microsurveys ask just one core question (with an optional conditional question), making them quick and easy to complete. By reducing the number of steps the customer needs to take, microsurveys reduce friction.
As they appear right on the screen, they also eliminate the need to leave the website or app to give feedback. This results in a higher response rate and even more valuable data for your business.
Microsurveys allow you to ask the right questions at the right time with customisable triggers. Your microsurvey could appear on a certain page, like a booking confirmation. Or it could pop up when a customer clicks a specific button, for example after hitting ‘Send’ on a message. This helps capture feedback when the topic is still fresh in the customer’s mind (which will again make them more likely to respond!)
In-web and in-app surveys can be used for many different question types depending on your business goals. This includes:
Let’s take a look at a few ways microsurveys can be used in practice.
In a bid to increase revenue, a hotel is looking to optimise its booking process. To do this, they collect opinions using one simple question that appears when a user has completed a booking.
This Customer Effort Score (CES) question offers a simple way to learn how easy the user found the booking process. Depending on the score given, the in-web survey could also include a follow-up, free text question, like:
A car dealership wants to know why some customers cancel their maintenance plan so they can improve their offer. To do this, they ask a single, multiple-choice question to users of their app when they have completed a cancellation.
The car dealership can then analyse the responses for trends to steer the direction of their service. For example, if most respondents answered ‘It was too expensive’, the dealership may consider lowering the monthly cost or introducing an additional service into the plan.
A company wants to identify their most loyal customers and convert them into brand ambassadors. A single Net Promoter Score (NPS) question gives them the ideal solution.
Again, the company could ask a follow-up question that changes depending on the score given. Run continuously, this microsurvey will also allow them to track changes in overall customer loyalty.
Simply schedule a call with your Customer Success Manager who will answer your questions and help you get set up! Alternatively, if you are not yet working with Customer Alliance but would like to find out more, you can schedule a free, no-obligation demo with us by clicking the button below.

“We know that people want to hear other people’s experiences to help them make decisions.”
That’s what Google say about the development of Search Generative Experience (SGE). Soon, being found online won’t just be about optimised websites and targeting keywords. It will be about your entire digital footprint, including how other people talk about your brand.
In this article, we’ll explore how this evolution is set to shift the way businesses approach online visibility and give you a clear strategy going forward.
Understanding and adapting to these changes is crucial for anyone looking to stay ahead in the digital marketplace. So let’s demystify SGE–your roadmap to mastering the future of online search starts here.
To understand why external content will be so powerful for online visibility, first, we need to get familiar with the goal of SGE.
According to Google:
“With the new generative AI functions, search becomes even more efficient. Thanks to these advances, you can understand a topic more quickly, gain new perspectives and insights, and complete your tasks more easily.”
What does this mean in practice? Imagine a traveller, let’s call her Sarah, planning a trip to Paris. She’s not just looking for any accommodation; she wants to stay in a quintessentially Parisian boutique hotel. It has to be pet-friendly because her dog Roscoe goes wherever she goes. Sarah also cares about sustainable practices and wants to make the most of Paris’s café scene.
Traditionally, Sarah might search “pet-friendly boutique hotels near Eiffel Tower”. She would likely click on a few different pages, weigh up the amenities, read vague descriptions, and cross-reference locations. Then once she’d narrowed down her best options, she might check for sustainability credentials and search the areas for local cafés.
SGE aims to condense Sarah’s quest into a single, intuitive search query: “Eco-friendly pet-friendly hotel in Paris near cafes”.
The websites that Google’s AI thinks are the most relevant for that query will show up at the top of the page, above organic rankings (and sometimes even above paid ads).
So how can you feed Google the information it needs to ensure your business shows up where it matters most?
As we pointed out at the start of this article, Google is interested in hearing what other people think of your brand, not just how you present yourselves.
That’s not to say that you needn’t bother optimizing your website for search—far from it—but it means that external content is just as important. This includes:
Together, these create a complete picture of your brand authority that tells Google how to include you in the search results. Their goal is to provide the most relevant content for their users, so the more information they have about you, the more accurately their algorithms can figure out where to place you.
Of the types of external content we mentioned above, we think reviews will become one of the most important factors for ranking when SGE rolls around. Why? Not only do reviews provide insights from people who’ve actually used your products or services, they also tell Google more about what you do well and how certain demographics might experience your business.
To prepare for SGE, we recommend three things:
Most businesses take a hands-off approach to reviews. They expect some, though not all, happy customers to share their feedback and leave their review volume up to chance.
If you want to reap the benefits of reviews for SGE, you need to take a more proactive approach. There are many ways you can encourage customers to leave reviews. The key is to make it as quick, convenient and easy as possible.
Here are a few ideas to get you started:
Pro tip 💡 use review management software to automate review collection. Platforms like Customer Alliance offer the most efficient way to consistently increase your reviews. Our software sends automatic invitations that allow your customers to leave public reviews in a matter of seconds, with no manual work on your end.
Many reviews are surface-level, and don’t go into detail about their experience. This is fine if you just want to build up your review score on portals like Google or Yelp. However, to give search algorithms more information about your business your reviews need to include relevant keywords.
Simple prompts can help you get richer reviews that offer more information for potential customers and Google alike. For example, rather than simply asking guests you leave a review, you could ask them if there was anything they particularly enjoyed about their experience or the nature of their visit.
You can also think about this strategically. Say you’re a general manager of a hotel, and one of your unique selling points is your proximity to a popular tourist attraction. In this case, you might encourage guests to mention how they found the location convenient for their sightseeing plans.
Questions like, “Did our proximity to [Tourist Attraction] enhance your stay?” or “How did you find the convenience of getting to [Tourist Attraction] from our hotel?” can guide guests to provide reviews that highlight this key aspect of your hotel.
Remember, it’s important to make these prompts as natural and unobtrusive as possible. The aim is to encourage guests to share their genuine experiences in a way that also feeds directly into SGE’s demand for specificity and personalisation
The quality of your responses can be just as influential as the reviews themselves in shaping public perception and improving your SGE rankings. Responding to all types of reviews, not just the positive ones, shows a well-rounded and authentic approach to customer service. It provides additional content for SGE algorithms to scan, improving your search relevance and demonstrating active engagement with your customer base.
A good review response should be personalised, addressing the customer by name if possible, and reflect genuine appreciation for their feedback. Whether the review is positive or negative, acknowledge the customer’s experience.
For positive reviews, express gratitude and reiterate any specific points they praised, subtly incorporating relevant keywords. For example, if a review mentions the high-quality breakfast at your hotel, you could suggest the guest might enjoy the restaurant’s signature three-course tasting menu during their next stay.
In the case of negative reviews, respond with empathy and a commitment to improve. Apologise for any issues they faced, and if appropriate, offer a way to rectify the situation. This not only demonstrates good customer service but also reassures potential customers reading the reviews.
Pro tip 💡 use AI to keep up with your review responses.
As you collect more reviews, you may find that it’s hard to respond to each one manually. Customer Alliance’s AI Reply Assistant will drastically reduce the time spent replying while generating consistently high-quality, personalised responses.
With SGE on the horizon, your customer reviews are set to become more crucial than ever. They’re not just snapshots of customer sentiment. They’re the blueprint for how you show up online.
The key isn’t just getting more reviews–it’s getting richer, more detailed feedback. Engage with these reviews genuinely–thank your customers, address concerns, and show you’re listening. It’s not just good customer service; it’s smart SEO strategy.
Embrace this shift. Use your reviews to paint a vivid picture of your business for Google’s AI. Do this, and you’re not just adapting to the future of search–you’re owning it.

It’s a Monday morning, and you settle into your chair, cup of coffee in hand, ready to check your latest reviews. A stream of positive feedback flows by, validating your team’s hard work. But then, you spot it—a harsh, critical review that makes your heart sink. As you read closer, though, something’s off. This isn’t a dissatisfied customer; it’s a fake review.
But before the panic sets in, know this: you’re not powerless. By the end of this article, you’ll know how to combat fake reviews and minimise their impact on your business.
Before you tackle the suspicious review, let’s review Google’s guidelines. They’ve provided clear rules about which reviews can be removed.
After acquainting yourself with Google’s guidelines, revisit the review in question. Does it violate any of the above policies?
If you’re unsure, it’s still worth flagging the review. Google’s support team will then assess its validity. It’s always better to bring a potential issue to their attention than to let a possible fake review tarnish your business’s reputation.
Fortunately, requesting that Google remove a review is fairly straightforward. Here are step-by-step instructions to guide you through the process.
Finding the review on your profile:

Once you’ve identified the fake review:

Describing the review:
After clicking the flag:

It’s disheartening when a clearly fake review remains on your profile even after you’ve reported it. However, Google provides another way to assert your case – a one-time appeal. Here’s how to navigate this process:
Understanding the criteria for re-evaluation: Before proceeding, it’s essential to know that Google will only re-evaluate reviews based on their guidelines and policies. This means that the content of the review should clearly violate these guidelines for a successful appeal.
Steps to launch your appeal:
How to make your appeal stand out
After submitting an appeal for a review on Google, the response time can vary. Typically, you can expect to hear back from Google within 3 to 5 business days, although this can be longer during peak times or for complex cases. It’s essential to remain patient and periodically check your email, including the spam folder, for any notifications from the Google My Business team.
While it’s frustrating when Google won’t take down a fake review, it’s not the end of the world. In fact, how you respond can make a significant difference in how potential customers perceive your business.
Responding to a review—especially a fake one—requires tact and professionalism. Your response can influence potential clients and show that your business values feedback and integrity.
Tips for crafting a professional response
Remember, your response isn’t just for the person who left the review—it’s for all the potential customers reading it. By showcasing your professionalism and dedication to customer satisfaction, even a fake review can become an opportunity to highlight your business’s integrity.
Pro tip 💡 Customer Alliance’s AI Reply Assistant wites high-quality, personalised responses with just one click, making it easy to respond to even the trickiest reviews.
A single negative or fake review can disproportionately sway potential customers. However, one of the most effective ways to counteract this is by amplifying the voices of your genuine, satisfied customers.
Launching a review campaign can help spotlight these authentic, positive experiences. Here’s how you can get started:
Get new reviews on autopilot
Review management software like Customer Alliance enables you to send review invitations to your customers automatically. Since they constantly run in the background, they make sure you always have a steady stream of reviews coming in. This helps you maintain a strong online reputation while counteracting any isolated negative or fake feedback.
Fake Google reviews can be a challenge, but they’re manageable with the right approach. While it might be tempting to react emotionally to unjust feedback, it’s essential to remain calm and strategic. By staying informed and understanding the tools at your disposal, you can tackle these challenges head-on.
Remember, how you handle adversity often speaks louder than the adversity itself. Engage with reviews professionally, be transparent in your communications, and always prioritize the concerns of genuine customers.
Instead of getting frustrated with fake feedback, use it as an opportunity to showcase your business’s strengths. Your proactive approach to managing reviews, both real and fake, can set you apart from the rest.
A: If you believe a review is fake, the first step is to familiarize yourself with Google’s content and review policies. This helps you determine if the review in question violates any of their guidelines. If it does, you can proceed to report or flag it through your Google Business Profile.
Ensure you document the review (like taking a screenshot) before any actions, as you might need it later for reference or appeals.
A: If you’ve flagged a review and Google didn’t take action, it doesn’t mean the end of the road. You can submit a one-time appeal for a re-evaluation. Navigate to the Google My Business Help Center, choose “Contact Us”, and follow the prompts related to reviews.
When appealing, provide a clear, concise explanation about why you believe the review is fake, and if possible, share any evidence (like correspondence or transaction records) that supports your claim.
A: Absolutely! If a fake review can’t be removed, it’s important to respond to it professionally. A well-crafted response can reassure potential customers of your dedication to service.
Mention any discrepancies in the review without being confrontational and offer a way for the reviewer to contact you directly. Additionally, consider running a review campaign to encourage genuine, positive reviews from your satisfied customers, which can overshadow the negative impact of a fake one.
See how AI insights, automated workflows, and unified dashboards can reduce manual work and increase satisfaction across your hotel.
get personalized demo


