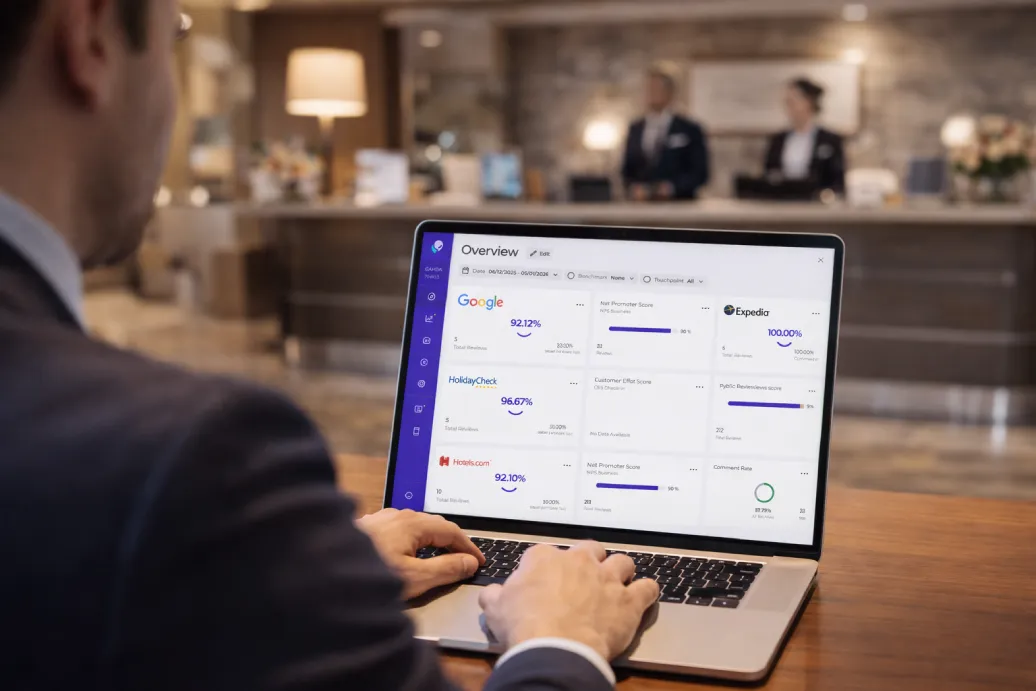
KEY DRIVER ANALYSIS
Key Driver Analysis shows which specific aspects of your guest experience most impact satisfaction scores
- Analyse data from Booking.com, Expedia and your guest surveys
- See your most impactful topics in an easy-to-read visual
- Get AI insights about exactly what guests love (and what they don’t)
From data to decisions in minutes
See Key Drivers Analysis in action in this x-minute video
Transform your team’s review meetings from hours of debate into focussed action planning – with everyone aligned on data-driven decisions
Stop wasting time on issues guests mention but don’t really care about. Focus your team’s energy on what impacts satisfaction
Present your plans for improvement knowing every cent is allocated on actual impact data – not guesswork or assumptions
Field tricky questions with the facts to back you up. Watch your projects deliver measurable increases in guest satisfaction (read: more potential bookings)
Walk into budget meetings knowing which parts of your guest experience drive satisfaction – and confidently defend them from potential cuts.
Find proven strengths to use in your marketing (or even try increasing prices of those amenities to boost RevPAR)
FAQs about Key Driver Analysis
Key Driver Analysis provides quarterly reports based on your most recent guest feedback data. Each report is generated on the first Wednesday of the new quarter, ensuring you have time to implement and measure improvements before the next analysis cycle.
The analysis incorporates feedback from your Customer Alliance surveys along with categorized data from Booking.com and Expedia. This combination of structured ratings and qualitative feedback provides a comprehensive view of what’s truly driving guest satisfaction.
For existing customers, the analysis includes data from the previous quarter. New customers will see their first report at the beginning of the quarter following sign-up, based on current quarter data. This ensures all recommendations are based on recent guest experiences.
Yes, to ensure statistical validity, you’ll need at least 50 survey responses and 3 different CSAT questions. The more data available, the more precise the analysis will be. Our system can process up to 75,000 data points per report.
Unlike standard tools that simply count mention frequency, Key Driver Analysis uses statistical correlation to determine which factors actually impact overall satisfaction scores. This reveals which aspects of your guest experience truly drive ratings—not just what guests mention most often.
Key Driver Analysis is available as an add-on feature priced at €59 monthly per report (location or brand). Volume discounts are available for businesses with multiple properties.
Make every improvement count. Get insights that move your metrics.
When you sign up to Customer Alliance, you’ll also get:
- Automated review and survey invitations
A central dashboard for all your reviews and survey data
Sentiment analysis to go deeper than star ratings
Smart tools to reply, track trends, and take action fast
Unlimited users on every plan
- …and much more